To truly understand “who we are” and how we compare with the broader community, we partnered with Diversity Atlas, a transformative platform to really understand our audience at the TechDiversity Awards in 2023.
Through the lens of Mutuality, this measurement reveals how our Awards cohort aligns with the community we serve.

Guests at the 2023 TechDiversity Awards
A Closer Look: Diversity Atlas delves deep into seven pillars, including Country, Language, Worldviews, and Personal Attributes. It’s a comprehensive approach, ensuring no facet of diversity goes unnoticed.
Key Findings: At the TechDiversity Awards, 380 participants took the Diversity Atlas survey, uncovering a rich tapestry of diversity:
- Gender: 63.4% Women, 32.9% Men, and 3.4% Other genders.
- Sexuality: 80.8% Heterosexual, 12.6% Not Heterosexual.
- Long-term Conditions: 24.2% reported a ‘long-term condition’.
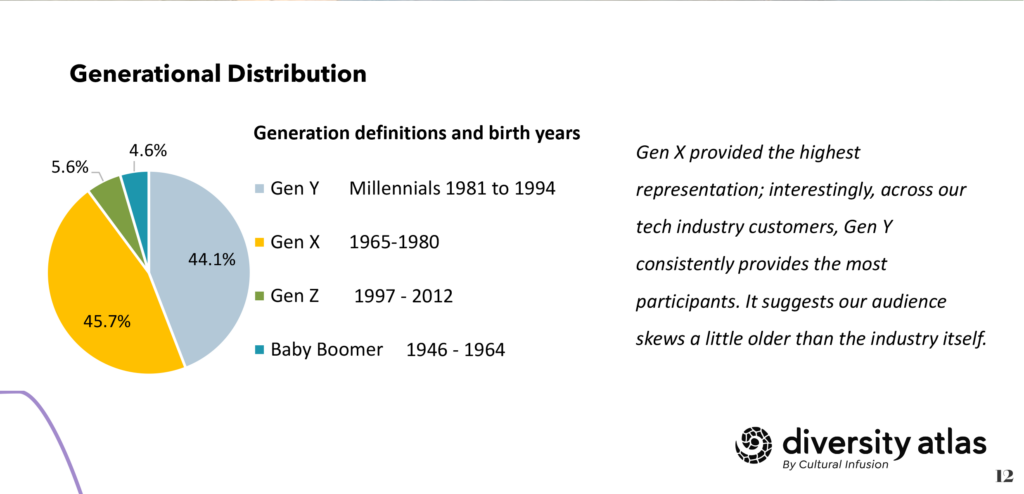
- Generational Distribution: 45.7% Gen X, 44.1% Gen Y.
Surprising Discoveries:
- Astonishingly, 75.3% of attendees were first-time Award participants, this is an incredible number. This influx of new participants signifies a fresh wave of interest and engagement in the principles of Diversity, Equity, and Inclusion (DEI). It suggests that the message of TechDiversity is resonating with an ever-widening audience, and more individuals and organisations are recognising the significance of DEI in the tech workforces. This surge in first-time attendees reflects a broader societal shift towards embracing diversity, making it a remarkable and encouraging development for our mission.
- Notably, women in ‘non-tech’ roles dominated, underscoring the need for diverse skills in technology.
- A substantial 36.3% held non-tech roles, reinforcing our belief that tech welcomes all.
- A remarkable 42.4% attendance by senior leaders signals that our DEI message resonates in boardrooms.
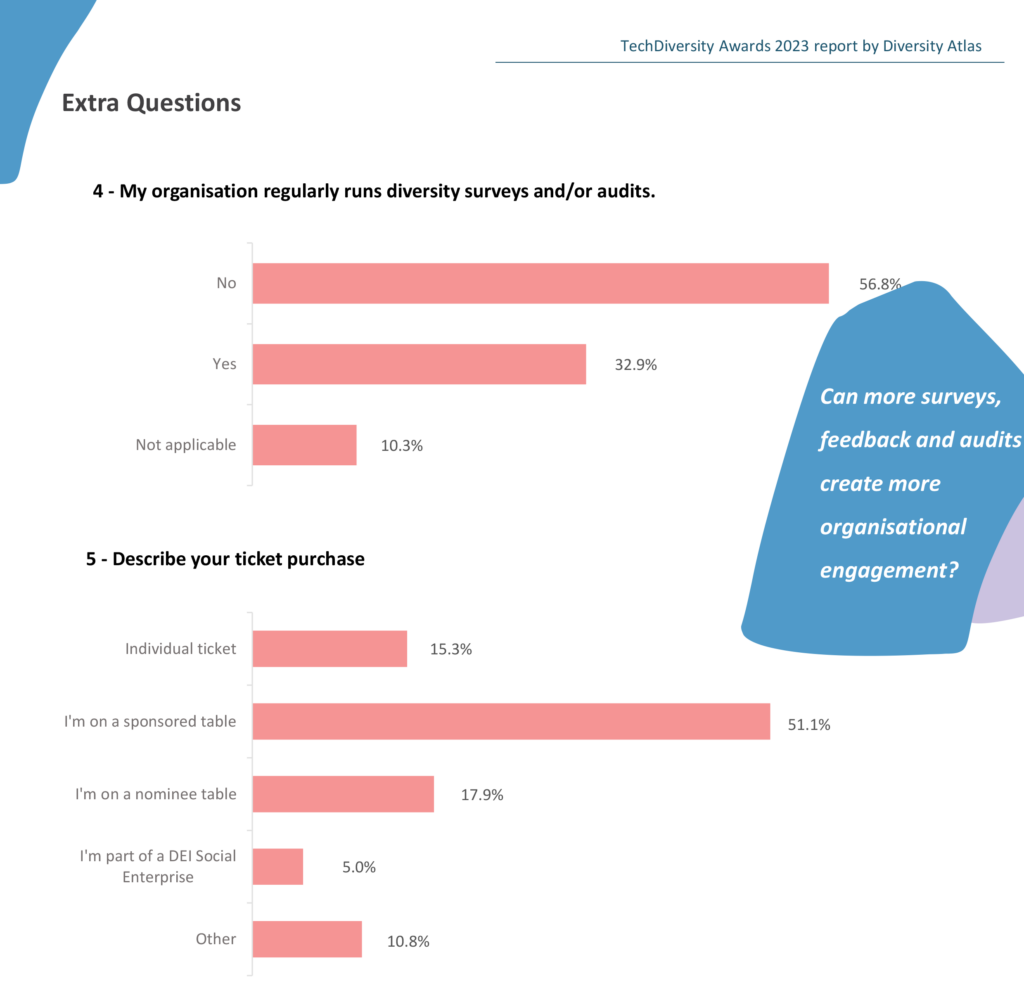
Leadership Engagement: Surprisingly, over 15% did not ‘agree’ that leadership supports DEI, despite a high percentage of leadership attending the TD Awards. It’s a poignant reminder of the importance of DEI measurement and audits. Shockingly, 56.8% reported their organisations don’t conduct diversity surveys or audits.
Generational Harmony: Our data revealed harmonious gender splits across generations, illustrating progress toward gender balance.
Ethno-Linguistic Alignment: Comparing our results to the Australian census, slight discrepancies emerged. Arabic and Vietnamese, both Top 5 languages in Australia, ranked lower (10th and 15th) among our cohort. Our challenge is to better align with our diverse community in terms of ethno-linguistic representation.
Data-Driven Impact: These insights reinforce our commitment to an inclusive tech community. They urge organisations to build a culture fostering productivity, innovation, and progress. Furthermore, they underscore the need for DEI audits and surveys to engage leadership.
Empowering Our Impact Statements: Our six impact statements now gain even more purpose from this data:
- Cultivating Talent: A diverse workforce fuels innovation and growth.
- Celebrating Innovation: DEI drives groundbreaking tech innovations.
- Fostering Competitiveness: Inclusivity gives a strategic edge.
- Building Futures: DEI crafts equitable, prosperous futures.
- Bridging Skills Gap: Inclusive practices unlock economic potential.
- Driving Innovation and Success: DEI links to remarkable success.
The Road Ahead: With our newly launched Enterprise Membership, we’ll extend this study to empower our members enabling them to understand who their tech workforce are and how they compare with the community they serve.
In conclusion, these insights reinforce our commitment to inclusivity, urging us to make every individual count in our journey toward a more inclusive tech community.

